二、环境搭建#
1. 下载安装包#
curl -O -L "https://github.com/grafana/loki/releases/download/v1.5.0/loki-linux-amd64.zip"
curl -O -L "https://github.com/grafana/loki/releases/download/v1.5.0/promtail-linux-amd64.zip"
wget https://dl.grafana.com/oss/release/grafana-7.1.0-1.x86_64.rpm
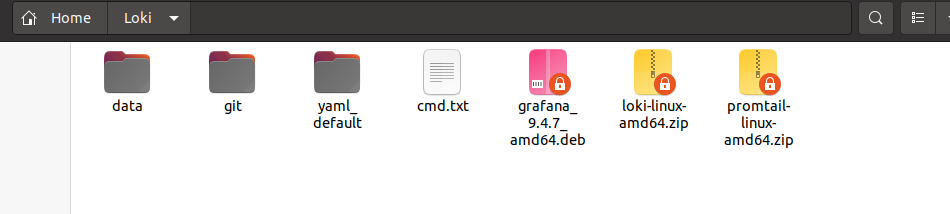
2. Loki安装#
mkdir  /data/loki/{chunks,index}
unzip loki-linux-amd64.zip
mv  loki-linux-amd64 /data/loki/
添加yaml文件, 内容如下:
auth_enabled: false

server:
  http_listen_port: 3100

ingester:
  lifecycler:
    address: 127.0.0.1
    ring:
      kvstore:
        store: inmemory
      replication_factor: 1
    final_sleep: 0s
  chunk_idle_period: 5m
  chunk_retain_period: 30s

schema_config:
  configs:
  - from: 2023-05-07
    store: boltdb
    object_store: filesystem
    schema: v11
    index:
      prefix: index_
      period: 168h   #每张表的时间范围6天

storage_config:
  boltdb:
    directory: index   #索引文件存储地址

  filesystem:
    directory: chunks  #块存储地址

limits_config:
  enforce_metric_name: false
  reject_old_samples: true
  reject_old_samples_max_age: 168h


chunk_store_config:
  # 最大可查询历史日期 90天
  max_look_back_period: 672h

# 表的保留期90天
table_manager:
  retention_deletes_enabled: true
  retention_period: 672h
3. promtail安装#
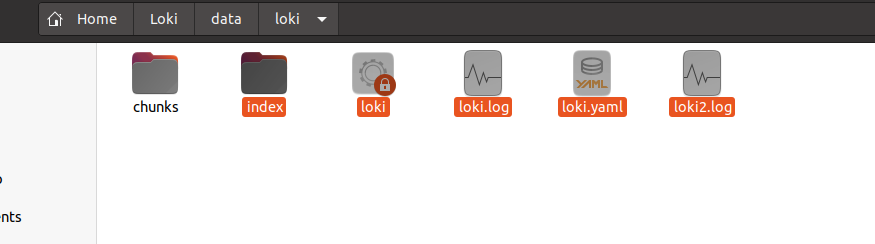
mkdir  /data/promtail
unzippromtail-linux-amd64.zip
mv  promtail-linux-amd64   /data/promtail/
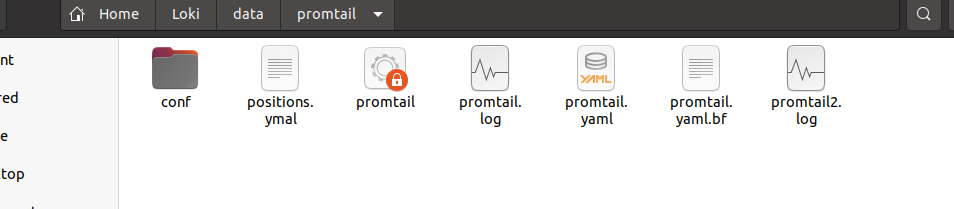
添加yaml文件, 内容如下:
server:
  http_listen_port: 9080
  grpc_listen_port: 0

positions:
  filename: ./positions.ymal
  ignore_invalid_yaml: true

clients:
  - url: http://127.0.0.1:3100/loki/api/v1/push

scrape_configs:
  - job_name: loki_log
    file_sd_configs:
      - files:
        - ./conf/*.yaml
        refresh_interval: 1m
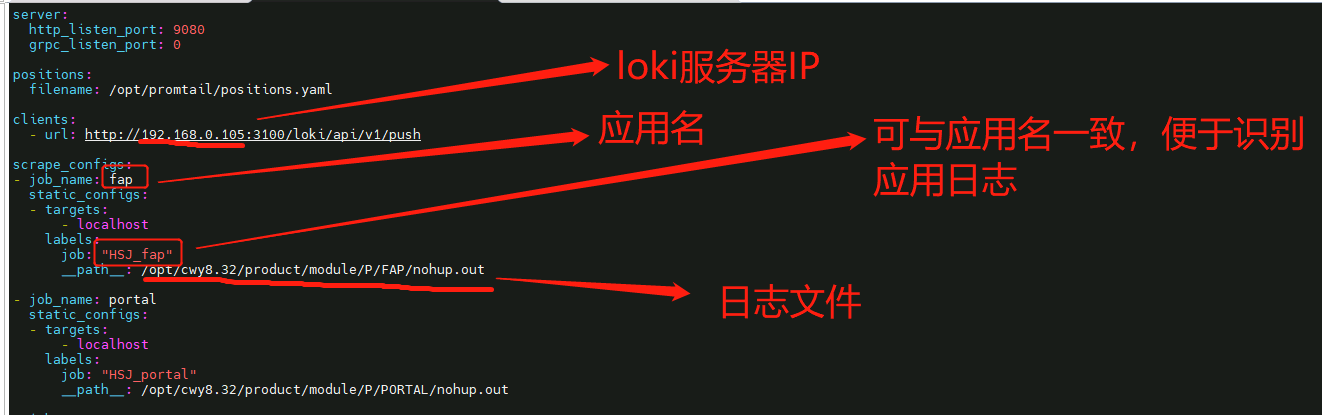
含义如下:
 并在conf目录添加log.yaml,加入日志目录,内容如下:
- targets:
    - 127.0.0.1
  labels:
    host: 127.0.0.1
    __path__: /home/yangrudan/Loki/data/tomcat/logs/*
4. Grafana安装#
双击deb文件进行安装
5. 启动#
分部cd到loki、promtail目录,依次启动loki、promtail、Grafana
nohup ./loki -config.file=./loki.yaml > ./loki2.log 2>&1 &

nohup ./promtail -config.file=./promtail.yaml > ./promtail2.log 2>&1 &

systemctl daemon-reload
systemctl start grafana-server
systemctl status grafana-server
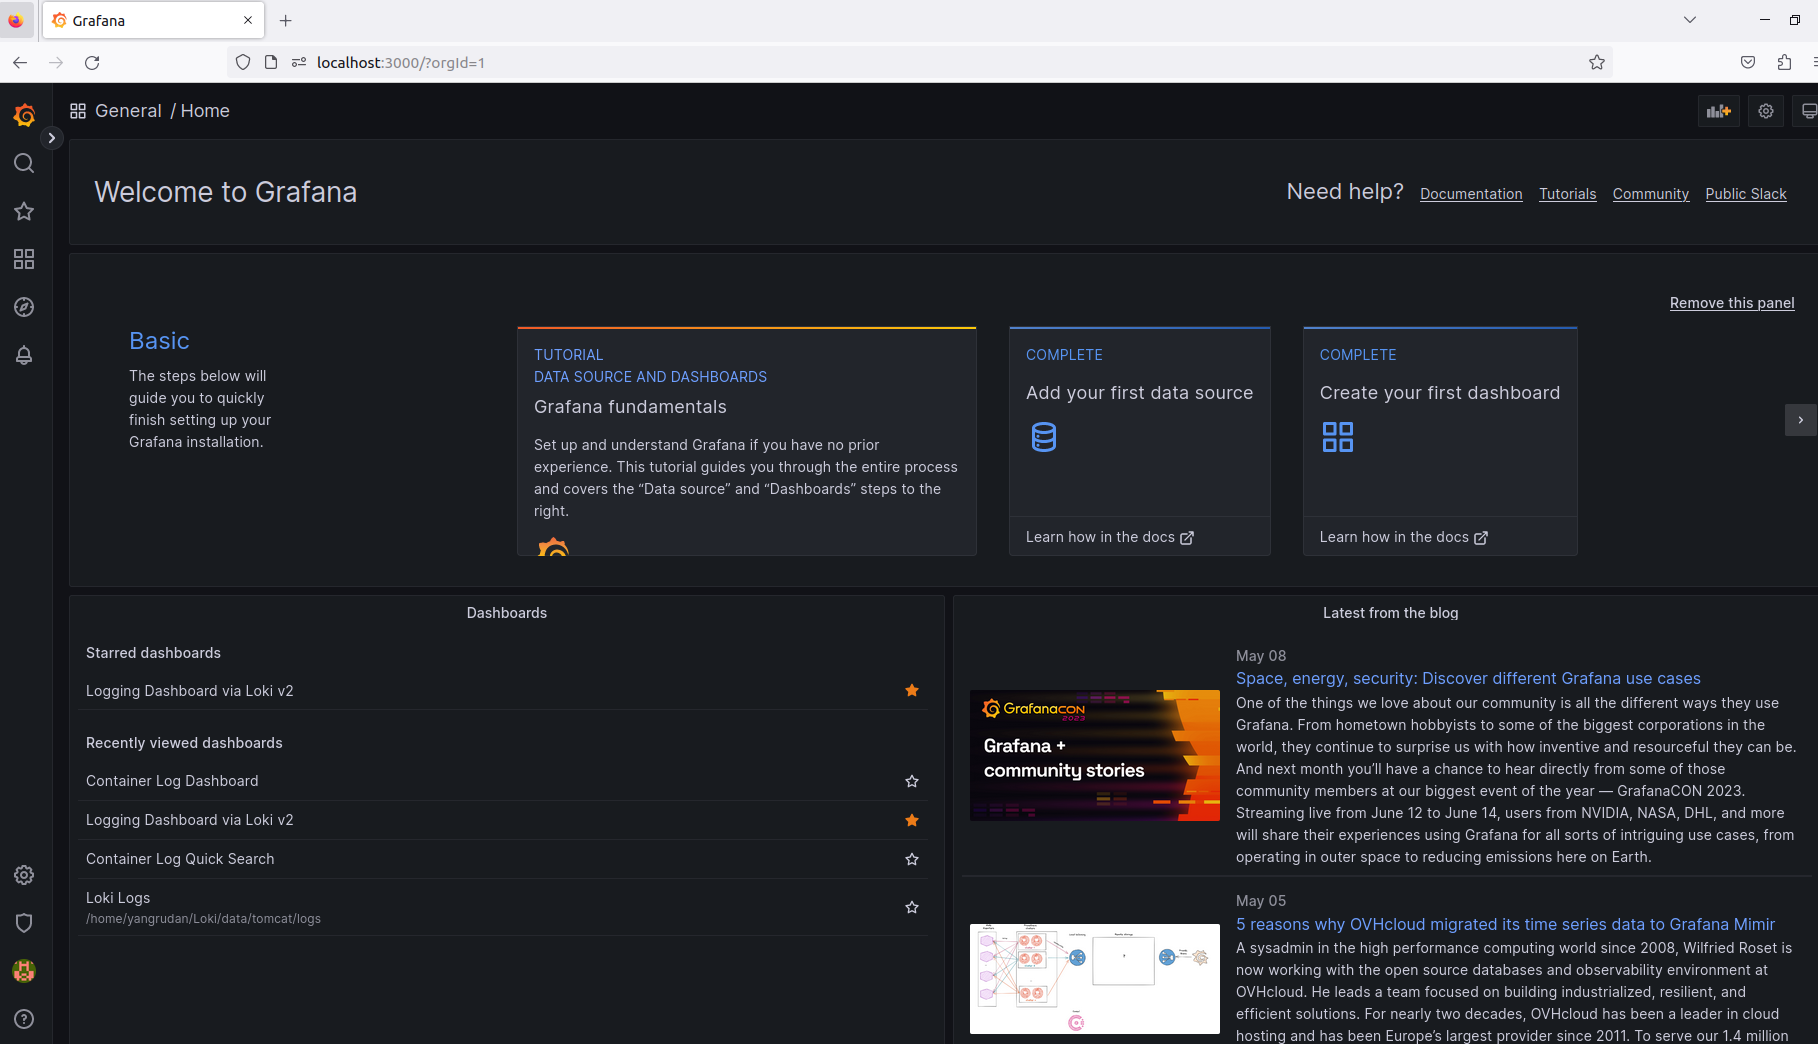
6. 进入Grafana界面#